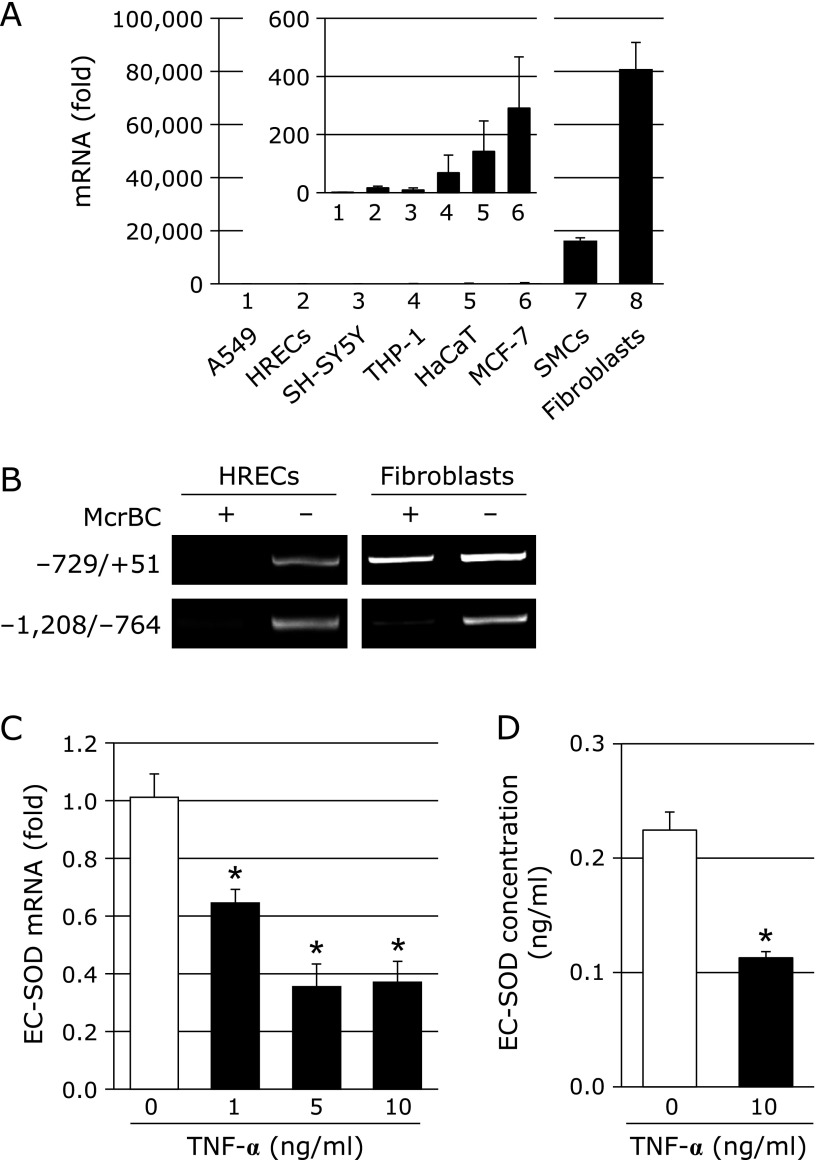
Fig. 1.
(A) EC-SOD mRNA levels in various cells. (1) A549, human lung adenocarcinoma epithelial cells; (2) HRECs, human retinal endothelial cells; (3) SH-SY5Y, human neuroblastoma; (4) THP-1, human monocytic leukemia cell line; (5) HaCaT, human skin keratinocytes; (6) MCF-7, human breast cancer cell line; (7) SMCs, human vascular smooth muscle cells; (8) fibroblasts, normal human dermal fibroblasts. Inserted figure shows the EC-SOD mRNA levels in cell Nos. (1) to (6). EC-SOD mRNA levels in cell Nos. (2) to (8) were compared to those in A549 cells (1). (B) Methylation status of the EC-SOD promoter. McrBC digestion analyses were performed on fibroblasts and HRECs. (C) Effects of TNF-α on EC-SOD expression in fibroblasts. Fibroblasts were treated with or without TNF-α (1–10 ng/ml) for 72 h, and EC-SOD mRNA levels were measured by real-time RT-PCR. Real-time RT-PCR data were normalized using 18S rRNA. *p<0.01 vs untreated cells. (D) Fibroblasts were treated with TNF-α (10 ng/ml) for 72 h. After the treatment, EC-SOD levels were measured by ELISA. *p<0.01 vs untreated cells.

