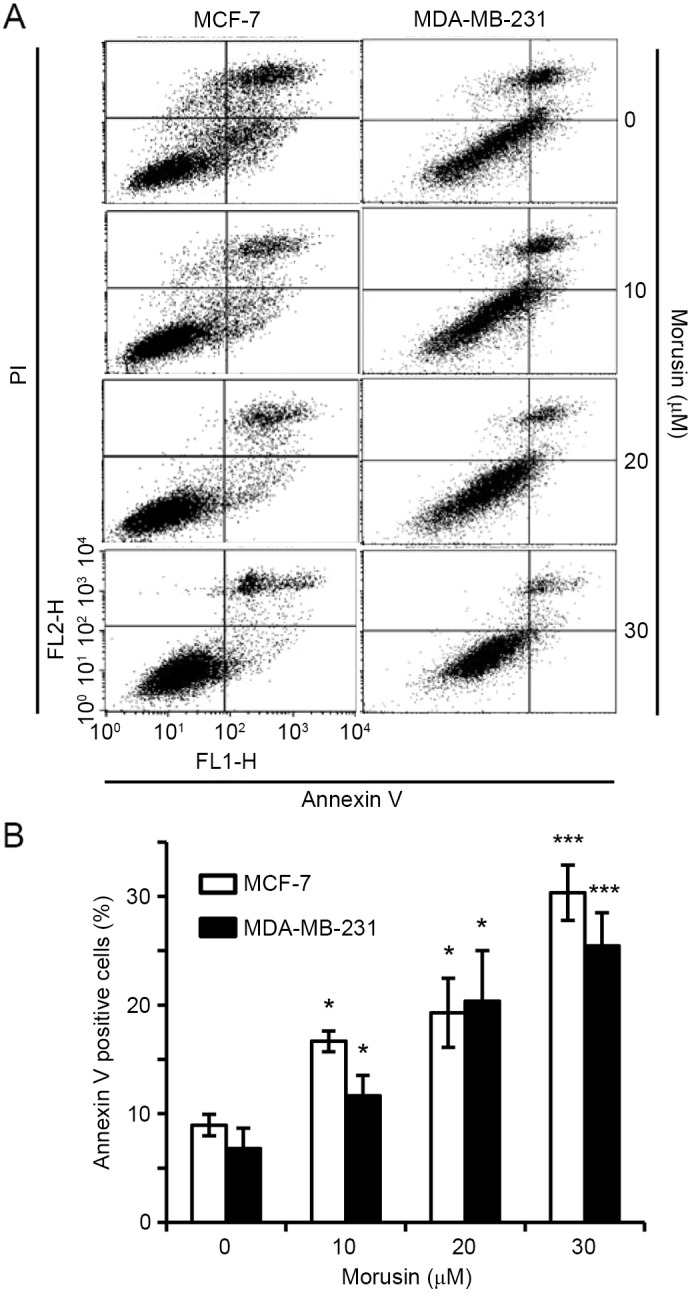
Figure 2.

Effects of morusin on apoptosis induction in human breast cancer cells. MDA-MB-231 and MCF-7 cells were treated with morusin for 48 h as indicated. The cells were analyzed using flow cytometry following staining with Annexin V and propidium iodide. (A) Representative plots of apoptosis analysis. (B) Percentage of apoptotic cell population. Data are presented as the mean ± standard error of the mean. *P<0.05; and ***P<0.001 vs. mock-treated control. PI, propidium iodide; FL1-H, relative intensity of green fluorescence; FL2-H, relative intensity of yellow fluorescence.
