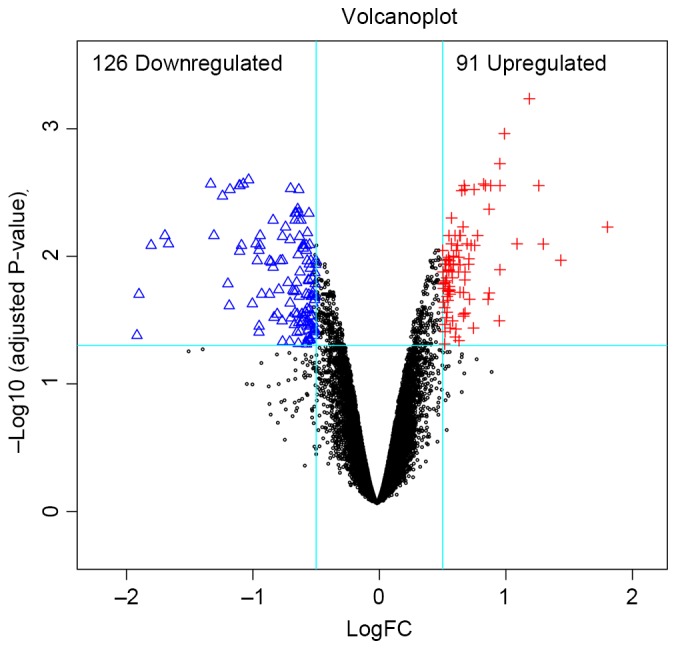
Figure 1.

Distribution of DEGs in euchromatic histone lysine methyltransferase 2-knockout samples. The red plus signs and blue triangles represent upregulated and downregulated genes, respectively. The black circles represent non DEGs. FC, fold-change.
