Figure 4.

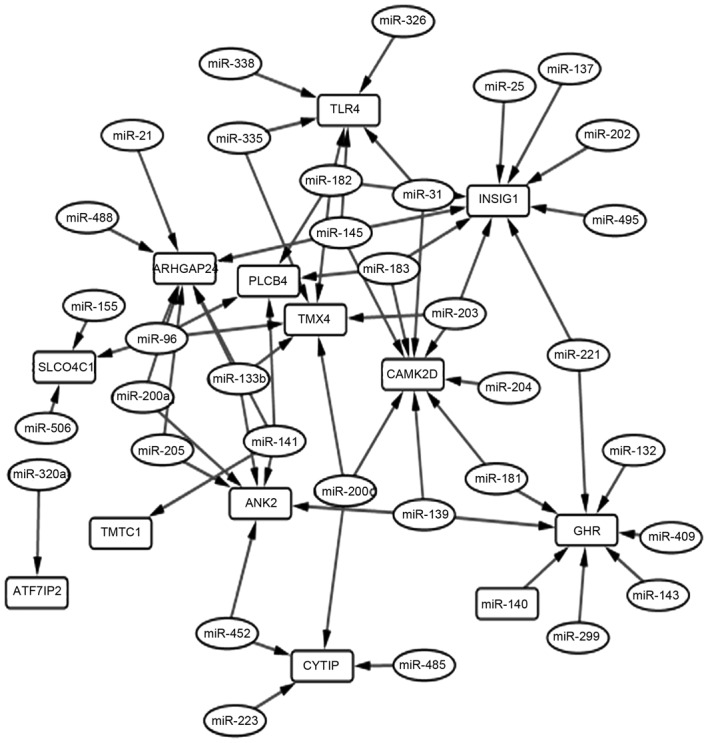
miRNA-gene regulation network. Rectangles show genes, whilst miRNAs are shown in ovals. Arrows represent the interactions between these genes and miRNAs.

miRNA-gene regulation network. Rectangles show genes, whilst miRNAs are shown in ovals. Arrows represent the interactions between these genes and miRNAs.