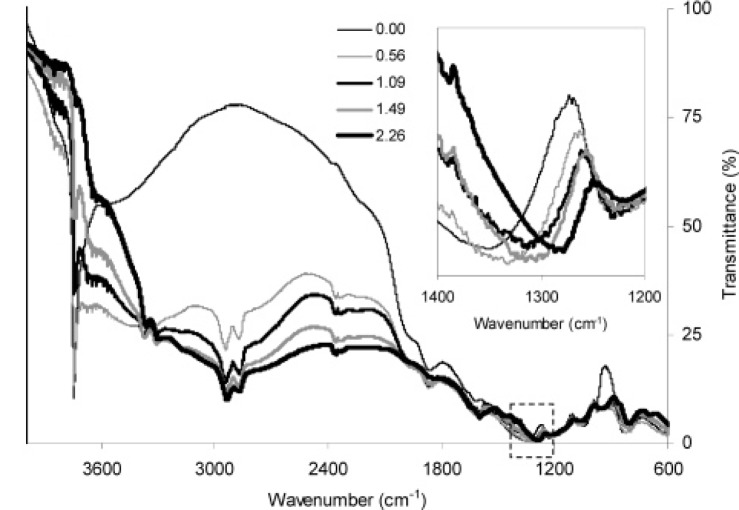
Figure 11.
FTIR spectrum of NH2–MCM–41 with different NH2 loadings. The insert figure displays the peak shift caused by the interaction between the amino and surface silanol groups. Reprinted with permission from [178]. Copyright 2006 American Chemical Society.

