
Figure 1.
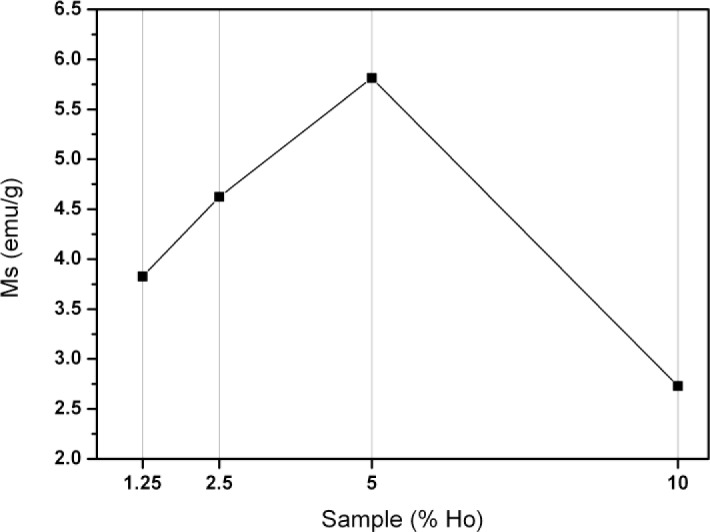
The saturation magnetization of the ferrites is plotted versus the molar percentage of holmium(III+) in the sample. An optimum is visible for the 5% sample, although the overall magnetization is lower than bulk magnetite. The line, connecting the data points, is solely a guide to the eye.