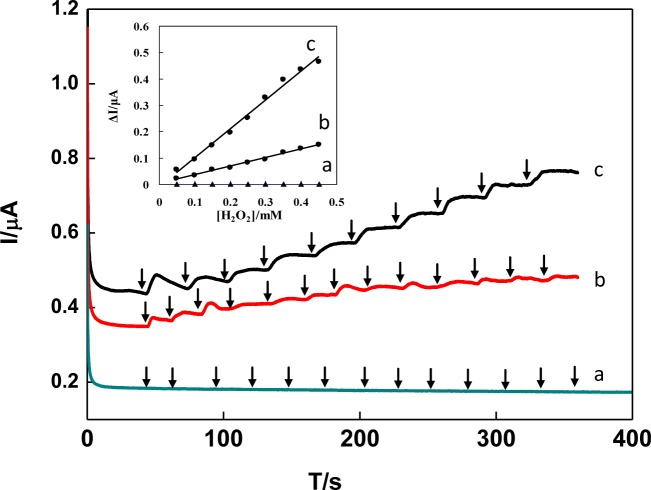
Figure 8.
Typical current-time response curve for successive addition of 0.1 mM H2O2 obtained by DNA/chitosan/GCE (a), DNA/chitosan/HRP/GCE (b) and DNA/chitosan/Fe3O4/HRP/GCE (c) in 0.1M phosphate buffer (pH 7.0) at applied potential of −0.25 V. Inset: the plots of amperometric responses (ΔI) vs. H2O2 concentration.

