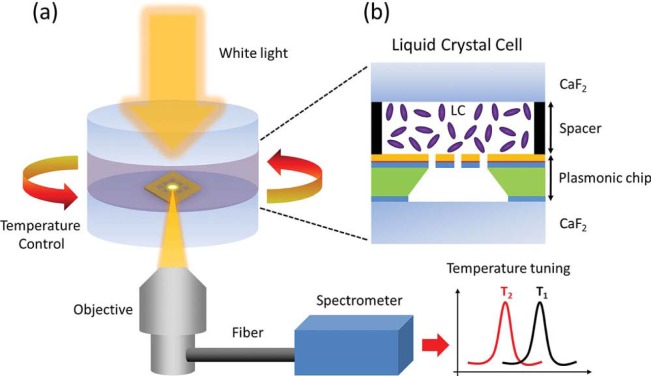
Figure 10.
(a) Schematic view of the experimental setup containing a liquid crystal cell thermally controlled by a heat bath, white light incident source collected by an objective lens and a spectrometer collecting the plasmonic response for different temperature values and (b) zoomed schematic of the liquid crystal cell between the upper CaF2 window and the plasmonic chip. This figure is adapted from reference [90].

