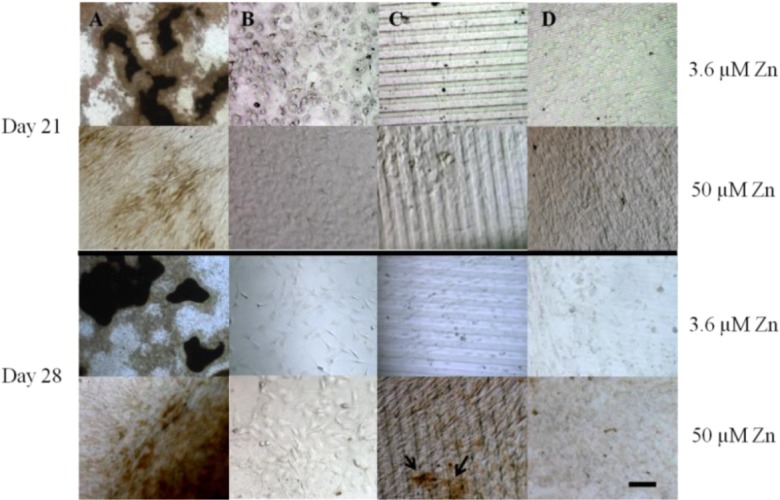
Figure 5.

Von Kossa staining for calcium phosphate bone nodules (indicated by black areas) of subclone 4 MC3T3-E1 cells on: (A) TC; (B) flat PDMS; (C) wide PDMS ridges; (D) narrow PDMS ridges. Areas are representative of up to six fields of view collected from three independent experiments. Bar = 100 μm.
