
Figure 6.
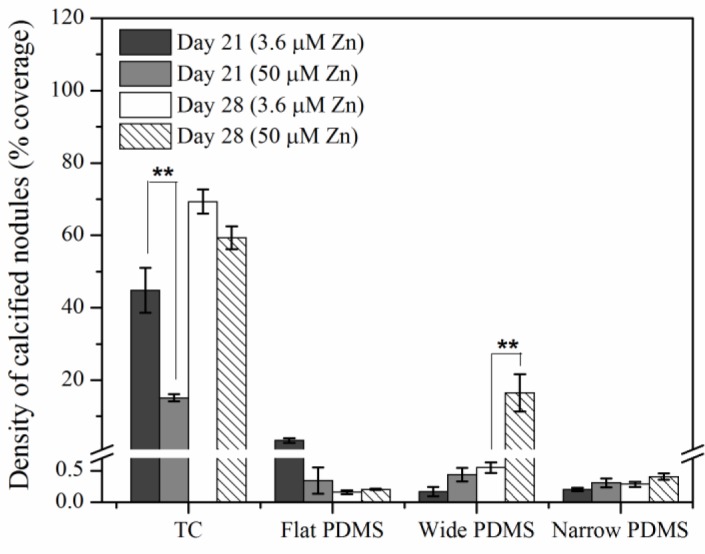
Quantitative calcified nodule density in MC3T3-E1 cell cultures after 21 and 28 days of exposure to induction medium. Densities represent the average area coverage of up to six fields of view collected from three independent experiments. Double asterisks (**) indicate a p < 0.05 level of significance.