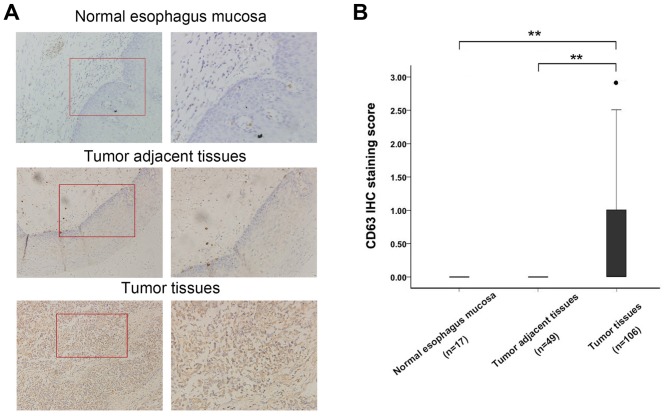
Figure 1.
(A) Representative IHC analysis of CD63 expression in human esophageal cancer tissues, adjacent esophagus tissues and 17 normal esophagus mucosa tissues. (B) Bar graph representing the range of CD63 IHC staining score in esophageal cancer tissues (n=106), matched adjacent esophagus tissues (n=49) and normal esophagus mucosa tissues (n=17), **P<0.01. IHC, immunohistochemistry.

