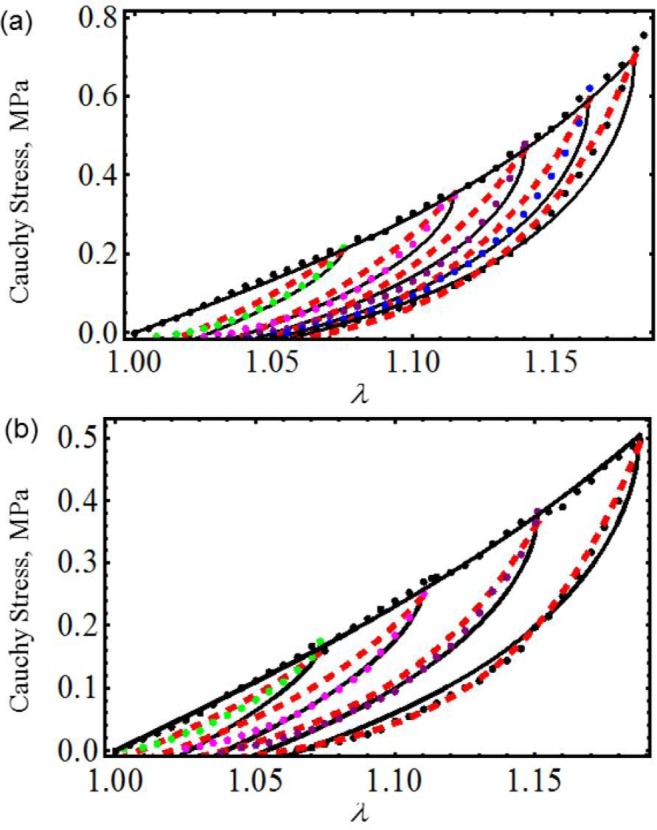
Figure 3.

Cauchy stress-stretch data for mice skin compared with the theoretical predictions. The material parameter values used to obtain the theoretical predictions are summarized in Table 1. (a) Male skin; (b) female skin. The solid black lines represent the theoretical predictions obtained from Equation (23); the dashed red lines are predictions computed from Equation (26), while the color dots describe experimental data adapted from [18].
