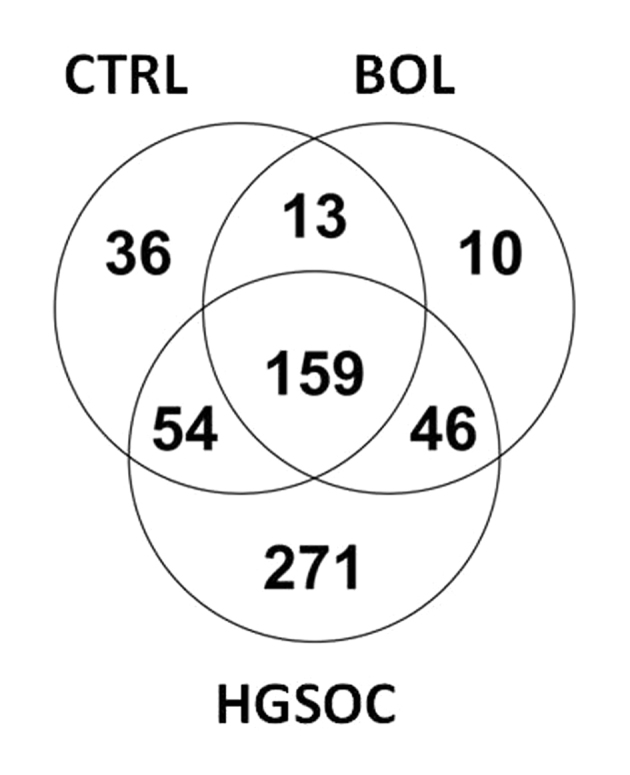
Figure 1.

Protein Venn diagram. Culture supernatants of CTRL (n=4), BOL (n=3) and HGSOC (n=8) cells were analyzed by liquid chromatography-electrospray ionization-mass spectrometry/mass spectrometry. The number of identified proteins is indicated for each category. CTRL, ovarian control; BOL, benign ovarian lesion; HGSOC, high-grade serous ovarian carcinoma.
