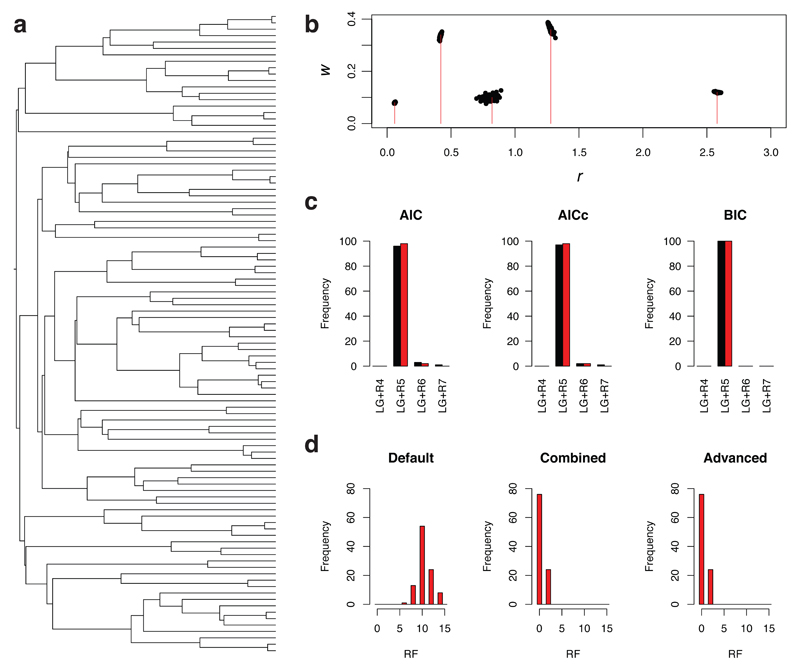
Figure 1. Assessment of the accuracy of phylogenetic estimates obtained using ModelFinder.
(a) The rooted 100-tipped tree, with a root-to-tip distance of 0.5 substitutions/site, that was used to generate the simulated data. (b) Plot showing the true values of ri and wi (red lines; ri = (0.06, 0.42, 0.82, 1.28, 2.58) and wi = (0.08, 0.34, 0.10, 0.36, 0.12)) and the estimated values of (ri, wi) for the 100 simulated data sets (black dots). (c) Histograms showing the number of times different models of SE were identified under different criteria (AIC, AICc and BIC) using the default (black) and advanced (red) search options. (d) Graphs showing the distribution of Robinson-Foulds (RF) distances between the true tree and (a) the tree used during the default model search (Default), (b) the tree found, given the optimal model of SE found using the default model-search option (Combined), and (c) the tree found during the advanced model search (Advanced) (the BIC optimality criterion was used in this example).

