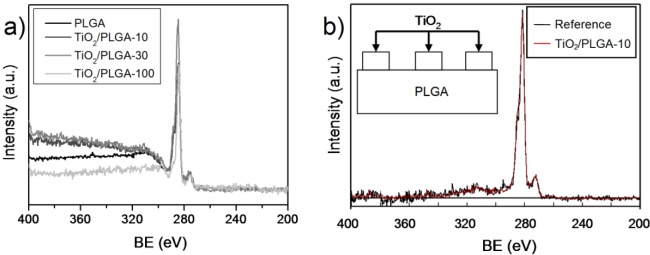
Figure 1.
QUASES analysis of the TiO2/PLGA samples. (a) C1s spectra of the indicated samples reporting a large background behind the elastic photoelectron peak; (b) comparison of the calculated and background subtracted spectra of sample TiO2/PLGA-10 using the QUASES software and model of TiO2 patches deposited on PLGA (inserted figure) [19].

