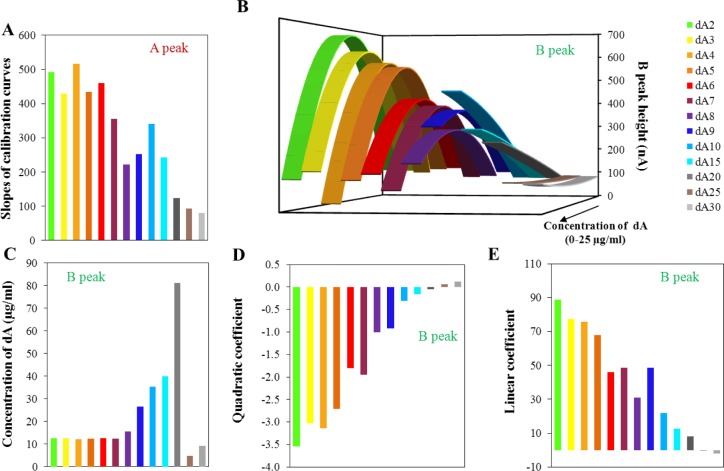
Figure 2.
(A) Slopes of linear concentration dependencies obtained from evaluation of intensity of peak A within the concentration range from 50 ng/mL to 25 μg/mL of adenine nucleotide; (B) Calculated quadratic dependencies based on the measured data obtained for the peak B within the concentration range from 50 ng/mL to 25 μg/mL of adenine nucleotide; (C) Determined concentrations of adenine nucleotides related to the local maxima/minima of calculated quadratic dependencies for peak B; not restricted to model concentration interval of adenine nucleotide; (D) Dependence of quadratic coefficient calculated from quadratic dependencies on various number of adenine bases in strand; (E) Dependence of linear coefficient of calculated quadratic dependencies on the various number of adenine bases in strand.

