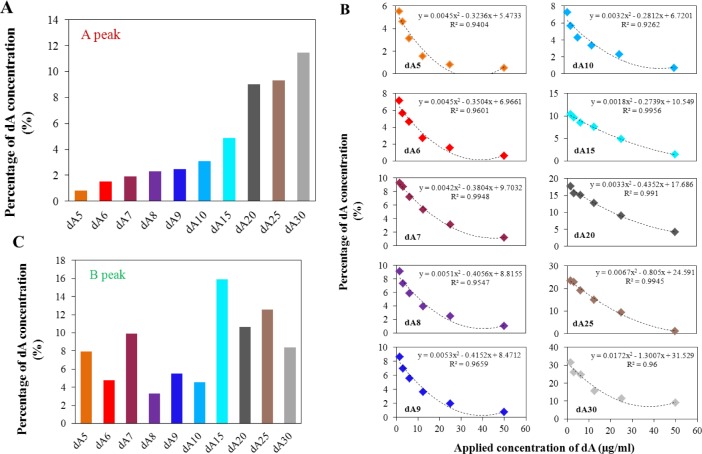
Figure 6.
(A) Percentage of concentration of adenine nucleotides after isolation process (related to the applied concentration) depends on the number of adenine bases in strand—evaluation based on peak A; applied concentration of adenine nucleotide was 25 μg/mL; (B) Percentage of adenine nucleotides concentration after isolation process (related to the applied concentration) depends on applied concentration of adenine oligonucleotides—evaluation based on peak A; (C) Percentage of concentration of adenine nucleotides after isolation process (related to the applied concentration) depends on number of adenine bases in strand—evaluation based on peak B; applied concentration of adenine nucleotide was 25 μg/mL.

