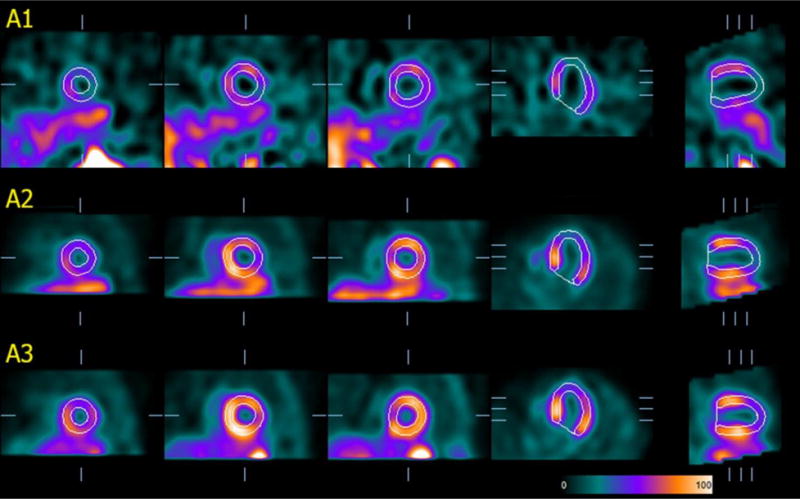
Fig.3.

Effect of the “same-patient processing” technique applied to the patient dataset previously displayed in Fig. 1-A. The image volume in A1 is actually the same as in Fig. 1-A, but this may not be immediately apparent, since counts are normalized relative to the LV maximum and representative slices to display automatically chosen based on the contours. For simplicity of illustration, only 3 of the 6 datasets in this patient’s folder are shown (A1=stress gated, A2 and A3 = stress and rest attenuation-corrected, respectively).
