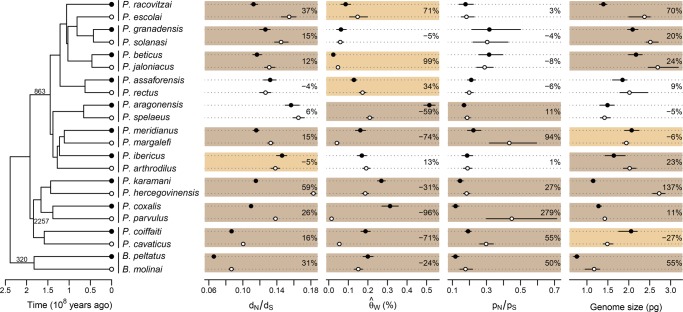
Figure 1.
Selection efficacy (dN/dS), polymorphism ( and pN/pS), and haploid genome size measurements for 11 pairs of surface and subterranean asellid species. Vertical bars next to the tree indicate species pairs with their surface (black circles) and subterranean (white circles) species. Numbers along branches of the tree are the numbers of single-copy genes used to estimate the dN/dS. Color boxes indicate statistical support (P-value <0.05) in favor of (dark brown) or against (light brown) a decrease in selection efficacy or population size, or an increase in genome size in subterranean species. No box indicates no statistical differences between species of a pair. Error bars represent 95% bootstrap confidence intervals, except for genome size where it represents the range around the mean for five individuals. The percentage change from surface water to subterranean species is shown for each species pair.

