
Figure 5.
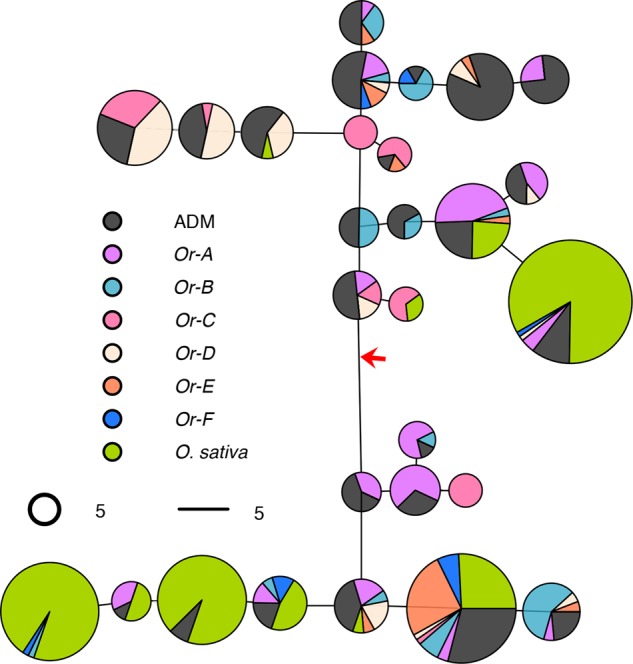
Chloroplast haplotype network among the 28 common haplotypes in rice primary gene pool. The haplotypes were defined using 74 common SNPs from the rice chloroplast genome. Each pie chart represents one haplotype, and it was further divided according to the subgroup information of the samples. All domesticated rice samples were colored in green, and wild rice samples were divided into seven subgroups. The root of the haplotype network was inferred using the chloroplast genome of O. meridionalis and is indicated by a red arrow. The length of lines connecting pie charts is proportional to the pairwise distance between haplotypes. The areas of the pie charts are proportional to the number of samples with the haplotype.