Figure 1.
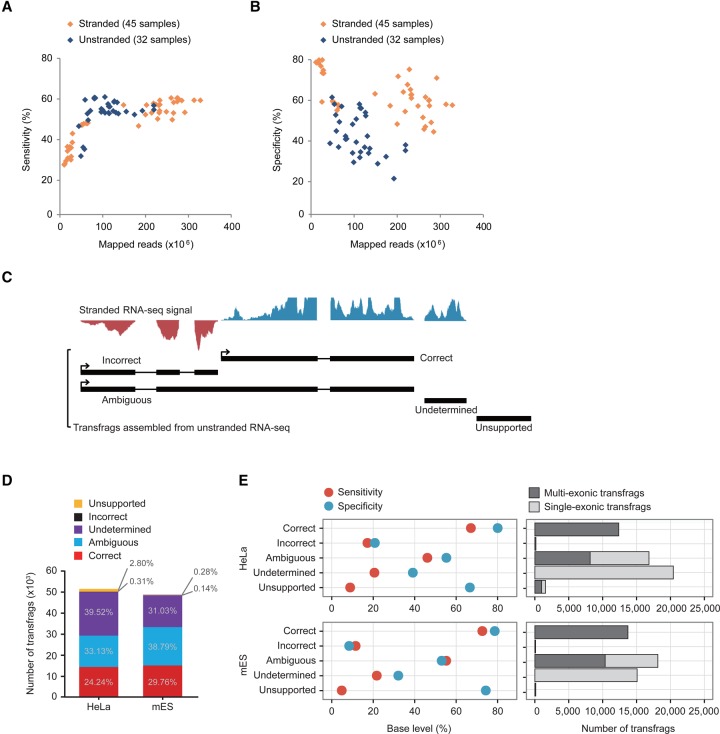
Error-prone unstranded transcriptome assembly. (A,B) Sensitivities (A) and specificities (B) of stranded (orange diamond) and unstranded (navy diamond) assemblies constructed from ENCODE RNA-seq data are shown over the number of mapped reads. (C) Classification of transfrags assembled from unstranded RNA-seq data. Graphs on the top are signals from stranded RNA-seq data (blue is the signal in the forward direction, and red is the signal in the reverse direction). (D) Shown are the percentages of transfrags belonging to the five groups—correct (red), ambiguous (blue), undetermined (purple), incorrect (black), and unsupported (yellow)—in HeLa and mES cells. (E) The specificity (light blue) and sensitivity (red) of the five groups compared to the reference protein-coding genes in HeLa (left, top) and mES cells (left, bottom). The number of multiexonic (dark gray) and single-exonic (gray) transfrags are indicated in each group (right).

