Figure 2.
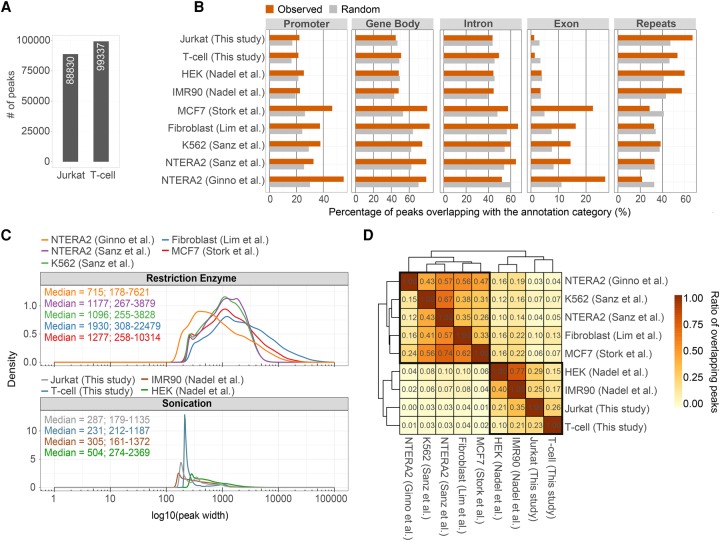
Summary of available human DRIP-seq experiments. (A) Bar chart showing the number of identified R-loop peaks in human Jurkat cells and naive T cells (this study). (B) Annotation of R-loop binding sites over functional genomic elements. DRIP-seq peaks were determined in Jurkat cells and naive T cells, and in other published cell types (NTERA2, K562, Fibroblast, MCF7, IMR90, HEK293T). The upper four rows represent DRIP experiments fragmenting the nucleic acid by sonication, while the lower five rows highlight restriction enzyme-digested DRIP samples. The difference between the two groups is especially noticeable over exons (associated to 14%–27% and 1%–3.5% of R-loops, respectively) and repeat elements (SINEs, LINEs, LTRs, simple and low complexity repeats) that involve 22%–38% and 54%–67% of the R-loop peaks, respectively. At other annotation categories (gene body, introns, and promoters), the difference was not significant between the two groups. (C) Density plots showing the distribution of R-loop peak sizes, classified by fragmentation method (restriction enzyme vs. sonication). Median peak length and 2.5%–97.5% quantiles are indicated. Peak length distributions differ significantly between the two fragmentation methods. (D) Heat map showing the overlap of R-loop binding sites between independent DRIP-seq experiments. Values and cell colors represent pairwise and unique overlap ratios between each peak set. The difference between the two nucleic acid fragmentation methods is clearly apparent, as peak sets from the same fragmentation process better resemble each other (highlighted in black).

