Figure 4.
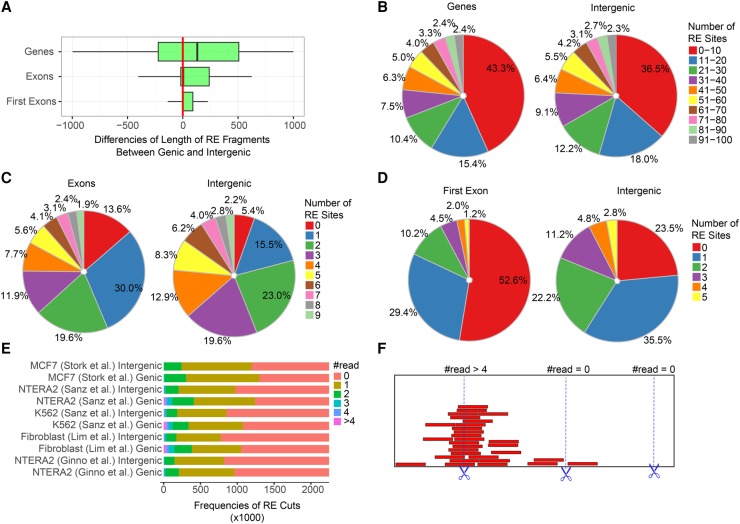
Analysis of restriction sites over genic and intergenic regions. (A) Restriction fragment lengths over genic regions (gene bodies, exons, first exons) are significantly larger compared to intergenic regions. The plot shows the difference of genic (observed) and intergenic (expected) fragment sizes in base pairs. The following enzymes were applied in combination: HindIII, EcoRI, BsrGI, XbaI, and SspI. (B–D) The number of restriction sites over genic regions is significantly lower compared to intergenic regions. Colors indicate the proportion of cutting sites in each category. Red and blue slices, marking the rarest restriction site frequencies, are prevalent over genic elements in each pie chart. (E) Cutting efficiency of restriction enzymes applied in the indicated DRIP-seq experiments. Zero read: the restriction site was cut. Greater equal than one read: the restriction site was uncut in a fraction of cells. There were uncut reads (sites) over half of the theoretical restriction sites. The proportion of uncut reads was even higher within gene coding regions compared to intergenic regions. See the model of cutting efficiency in panel F.

