
Figure 2.
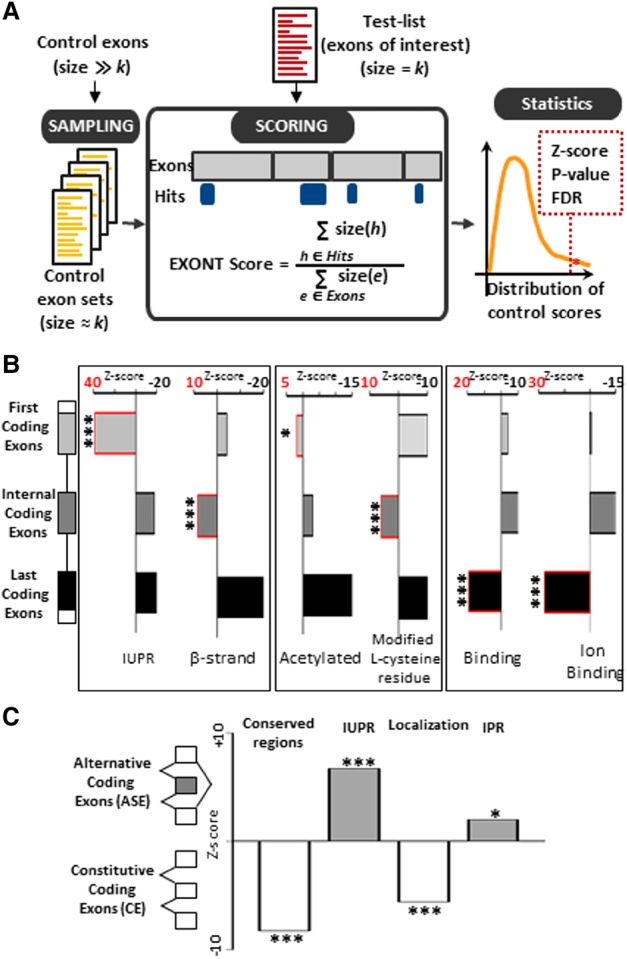
(A) Looking for enrichment of protein features (EXONT terms) encoded by a set of exons requires a quantitative measurement. The ‘EXONT score’ for each EXONT term associated with exons from a test-list is calculated by dividing the number of nucleotides covered by each EXONT term (size [h]) by the total number of nucleotides of each tested exon (size [e]). The enrichment Z-score and statistical significance are calculated by comparing the calculated EXONT score as described above to the scores obtained from a large number of sets of control exons having approximately the same size as the test-list. This analysis is available on the Exon Ontology website for the 91 EXONT terms that are most frequently associated with exons (listed in Supplemental Table S2). (B) Several Exon Ontology terms were enriched at either end of their mRNAs (first, internal, and last coding exons). The x-axis corresponds to the Z-scores obtained by comparing one category of exons to all exons. Positive Z-score values (red numbers and boxes) indicate EXONT term enrichment in the corresponding exon category. IUPR: Intrinsically Unstructured Polypeptide Region, Acetylated: Acetylated residues. (*) FDR adjusted P-value < 0.05, (***) FDR adjusted P-value < 0.005. (C) Constitutive and alternative coding exons are enriched for different EXONT terms. The y-axis corresponds to the Z-scores obtained by comparing alternative to constitutive exons. Positive Z-scores indicate enrichment of the corresponding EXONT term in alternative exons, while negative values indicate enrichment in constitutive exons. IUPR: Intrinsically unstructured polypeptide region, IPR: Intramembrane Protein Region. (*) FDR adjusted P-value < 0.05, (***) FDR adjusted P-value < 0.005.