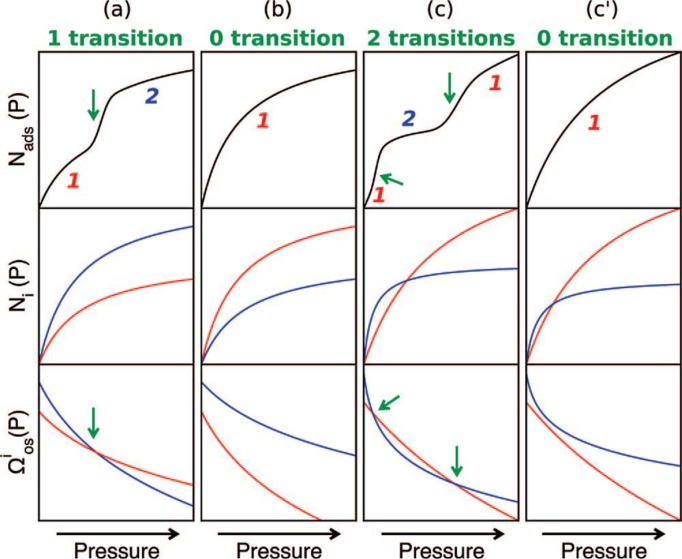
Figure 19.
The four potential scenarios of adsorbents exhibiting the structural transition between Phases 1 (red) and 2 (blue), using osmotic potential ensemble model. (Top) the adsorption isotherms; (Middle) the Langmuir isotherms of each phase in respective scenario; (Bottom) the osmotic potential of each phase. Green arrows indicate the occurrence of structural transitions. Reprinted with permission from [125]. Copyright 2008 American Chemical Society.

