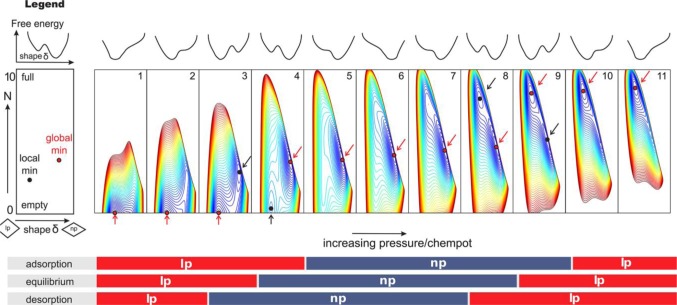
Figure 23.
Free energy simulation of CO2 adsorption on MIL-53(Cr) at 300 K under various pressure ranges. The blue-colored contour represents the lowest free energy, while the red-colored contour means the highest free energy. The under panel shows the expected framework structure during adsorption, equilibrium and desorption processes. Reprinted with permission from [132]. Copyright 2013 American Chemical Society.

