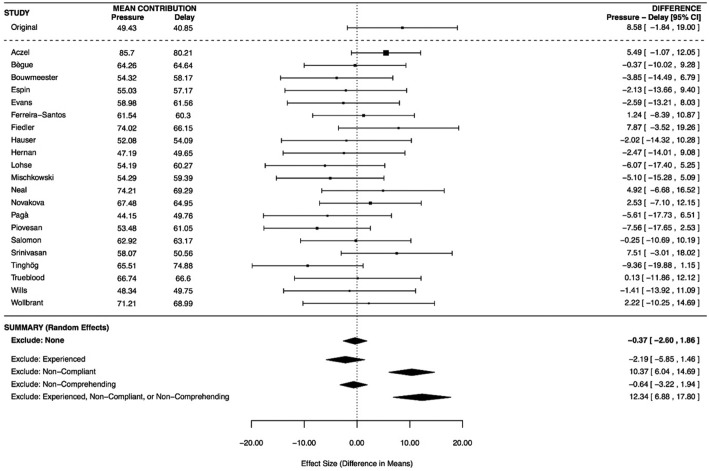
Fig. 1.
Forest plot and meta-analytic result for the difference in contributions between the time-pressure and forced-delay conditions. Studies in the forest plot are listed alphabetically by the last name of the first author for that lab’s study with the original result presented at the top. The mean difference for each lab is indicated by a square with the size corresponding to the inverse of the standard error of the difference score for that lab. The error bars indicate 95% confidence intervals around that laboratory’s mean difference. The diamonds in the Summary section represent the results of random-effects meta-analyses of the RRR studies with the width representing a 95% confidence interval around the meta-analytic difference. None of these meta-analyses includes the original Rand, Greene, and Nowak (2012) result. The first diamond corresponds to the data in the forest plot and represents the primary planned meta-analysis with all participants. The next three diamonds show the meta-analytic difference after excluding experienced, noncompliant, or noncomprehending participants. The final diamond provides the meta-analytic difference when excluding participants who failed to meet any one of these criteria. A forest plot for the data excluding noncompliant participants is provided in the General Discussion section. Forest plots for the other meta-analyses are available at https://osf.io/scu2f/.

