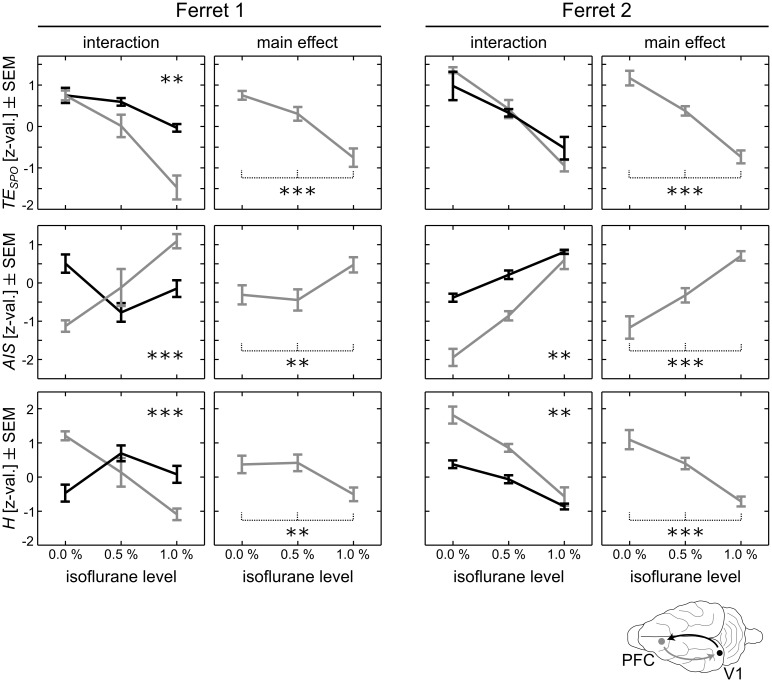
Fig 1. pANOVA results for nearest-neighbor based estimates of transfer entropy (TESPO), active information storage (AIS), and entropy (H).
Left columns show interactions isoflurane level x direction and isoflurane level x recording site for both animals; right columns show main effects isoflurane level. Grey lines in interaction plots indicate TESPO from prefrontal cortex (PFC) to primary visual areas (V1), or H and AIS in PFC; black lines indicate TESPO from V1 to PFC, or H and AIS in V1. Error bars indicate the standard error of the mean (SEM); stars indicate significant interactions or main effects (*p < 0.05; **p < 0.01; ***p < 0.001). Axis units for all information theoretic measures based on continuous variables are z-normalized values across conditions.

