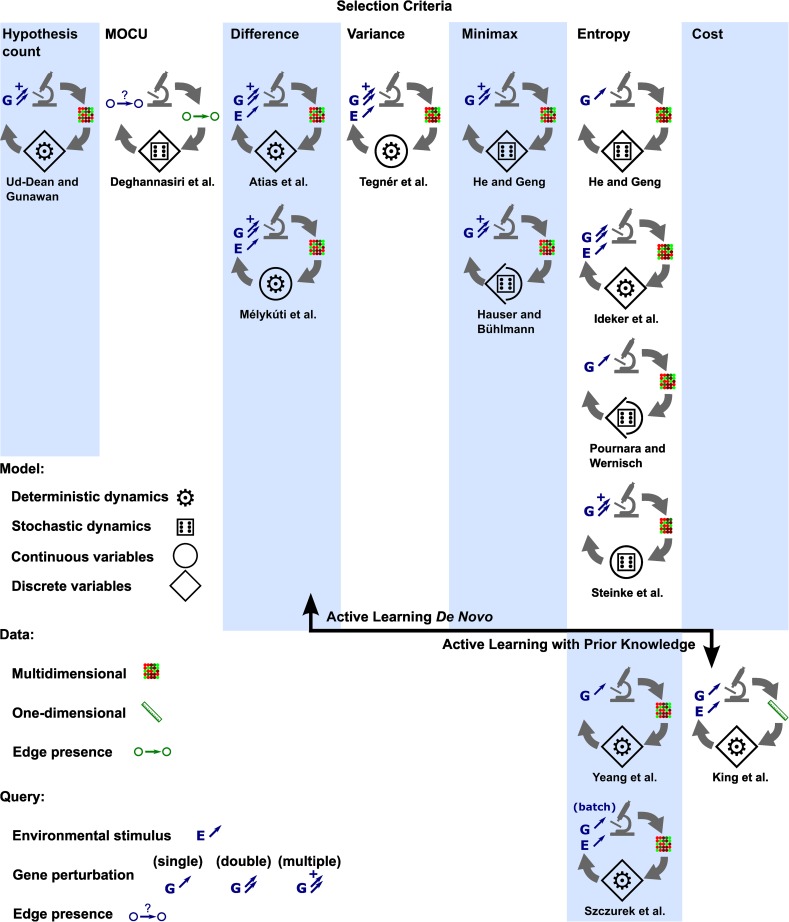
Fig 2. A brief summary of reviewed methods.
Icons arranged in the table represent individual methods. The columns represent the various experiment selection criteria, and the methods are divided vertically between de novo methods and methods that use prior knowledge. Visual elements in each icon indicate whether the method is deterministic (cog) or stochastic (die), whether it models continuous (circle) or discrete (diamond) variables, what is specified in a query for an experiment (G for genetic and E for environmental perturbations), and the dimensionality of the data used (dot array for multidimensional data and a ruler for one-dimensional data).

