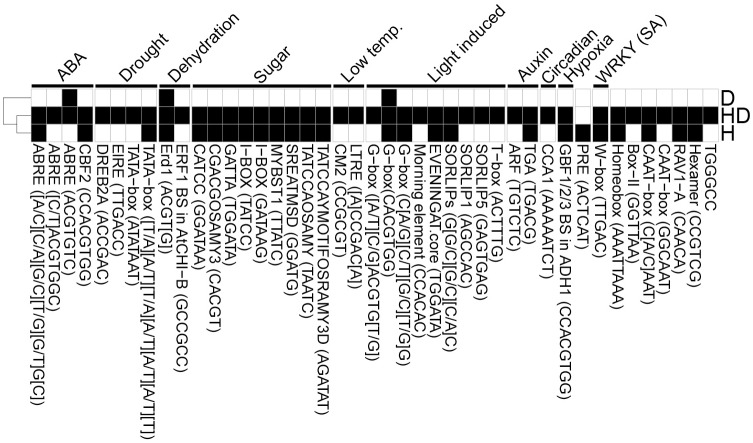
Fig 8. Motif enrichment in the differentially expressed genes.
Known cis-motifs were identified in the promoter regions 1000 bp upstream of the genes, and analyzed for enrichment using Fisher test. The p-values were corrected for multiple testing by Benjamini-Hochberg FDR correction. Black color: FDR ≤ 0.05 (significant enrichment), white: non-significant. Columns are motifs and their sequences, annotated to an associated biological process. Rows are heat, drought and combined heat and drought (H, D, HD) experiments (S3 Table).

