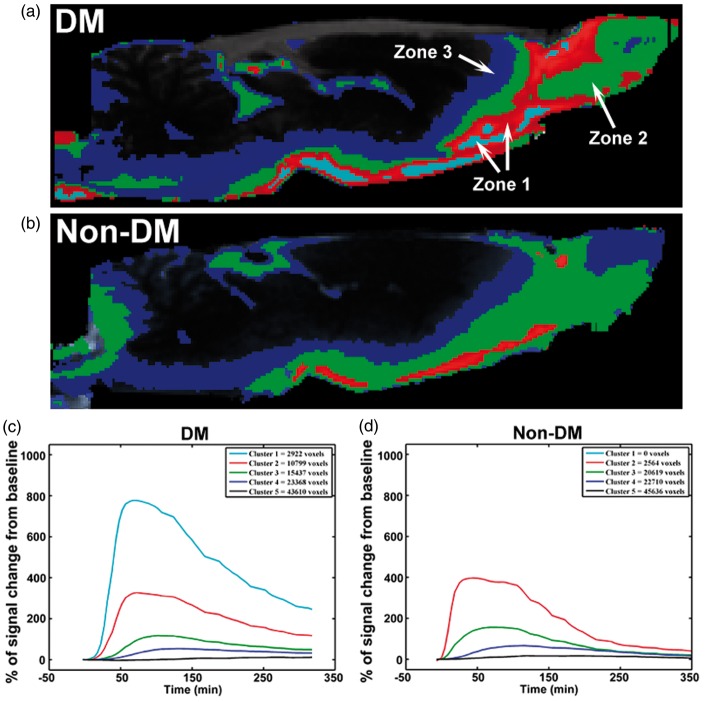
Figure 4.
Cluster-based spatial distribution of Gd-DTPA between representative non-DM and DM rats: Cluster analysis of DM rat (a) exhibited larger paravascular cluster (light blue and red, zone 1) and smaller intermediate parenchymal glymphatic pathways (green, zone 2), especially in other brain areas except the olfactory bulb compared with non-DM (b) rat. Panels C and D display the TECs for each of the 5 clusters with the total number of voxels for DM (c) and non-DM (d) rats.

