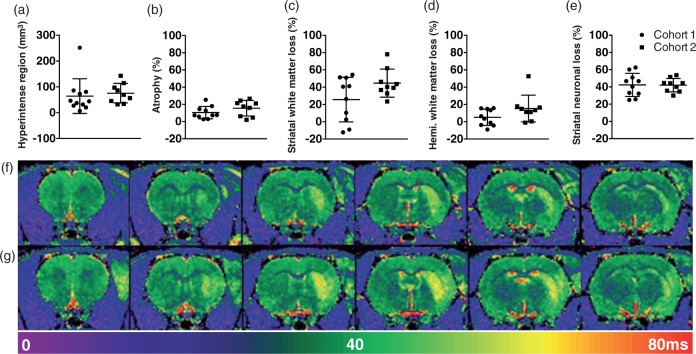
Figure 2.
Assessment of MCAO neuropathology in Cohorts 1 and 2. (a) Hyperintense volume on MRI at 24 h post MCAO surgery. (b) Percentage of hemispheric atrophy from histology at two months. (c) Percentage of striatal white matter atrophy, and (d) Percentage of total hemisphere white matter atrophy calculated from solochrome cyanine stained sections at two months. (e) Striatal NeuN cell loss as a percentage of the total number of cells in the Control group. (f) and (g) Representative T2 maps from animals in Cohorts 1 and 2, respectively. All graphs show mean ± standard deviation (SD), n = 11 and 9 for MRI and 10 and 9 for all other measures. No signifcant differences were found between the two Cohorts.

