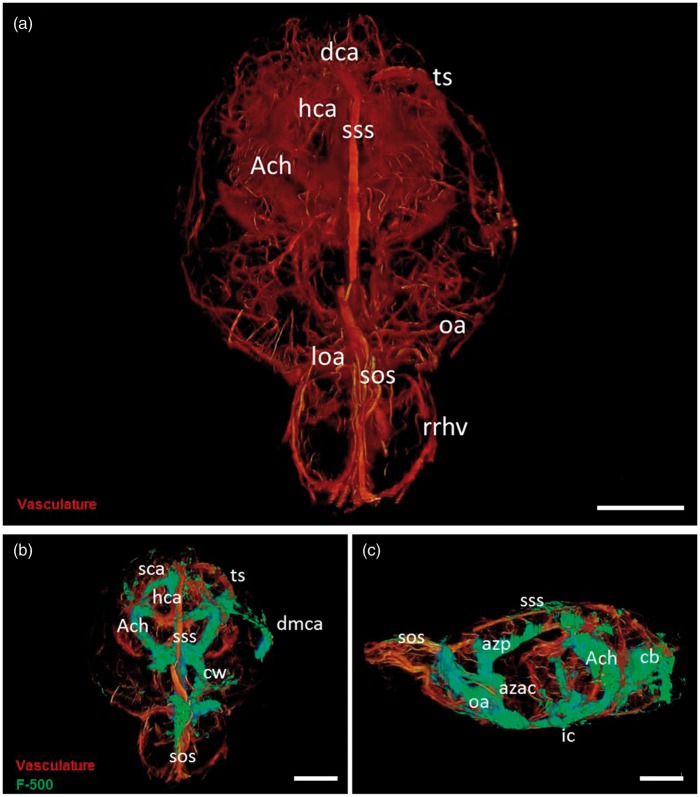
Figure 2.
3D visualization of the rat cerebral vasculature and CSF tracer distribution after infusion in the cisterna magna. Panel A: 3D reconstruction of the rat brain vasculature. Vessels were filled with fluorescent cast material (orange). Panel B: Frontal view of the rat brain. Tracer (F500, green) is visible around the circle of Willis (cw), and the anterior choroidal arteries (ach); along the dorsal portion of the middle cerebral artery (dmca), in the region of the hippocampal arteries (hca), and along the major sinuses-transverse sinus (ts) superior sagittal sinus (sss), and superior olfactory sinus (sos). Panel C: Lateral view of the rat brain. Tracer is present around the azygos anterior cerebral artery (azac) that dorsally becomes the azygos pericallosal artey (azp). Signal was present also caudally along the vasculature of the cerebellum (cb) and the around the superior sagittal sinus in the SAS. Scale bar represents 5 mm.

