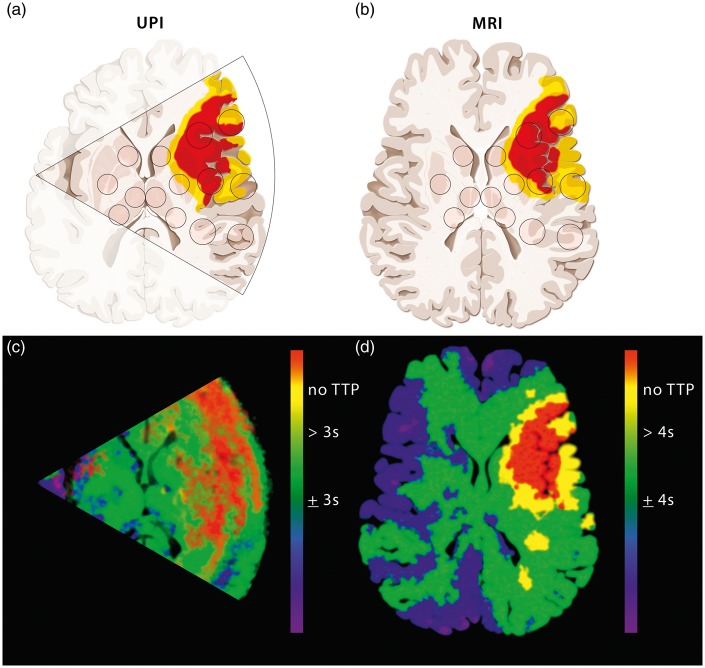
Figure 1.
Overview of the perfusion categories of the regions of interest (ROIs) in the ischemic hemisphere as measured by CTP/MRP and/or UPI. Schematic representation of the different diagnostic levels comparing the UPI insonation level (a) and the MRI scanning level (b) in a patient with left MCA occlusion. Sectional schematic images from HighMI UPI of the contralateral side (a) and axial images from MRI with perfusion imaging (b). Parametric images from UPI (c) and MRP (d) with threshold representation as described in our study (UPI 3 s; MRP 4 s). According to the threshold representation of the normal perfused (green), hypoperfused (yellow) and nonperfused (red) tissue. (Copyright Neurosurgery Department, Inselspital, Bern, Switzerland).

