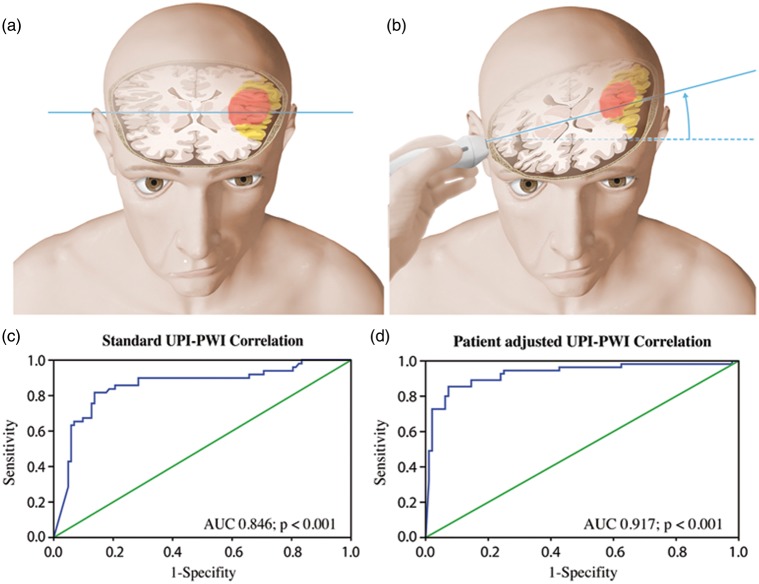
Figure 2.
Schematic representation of the different diagnostic levels showing the MRI scanning level (a) and the UPI insonation level (b) in a patient suffering of left middle cerebral artery occlusion. Representation of the diencephalic insonation level through the third ventricle and visualization of ipsi- and contralateral basal ganglia. Note that the insonation level has a 10–20° inclination in comparison to the MRI scanning level, causing anatomical differences between the two hemispheres. (c, d) ROC curves of UPI in comparison with MRP. Using the patient-adjusted analysis algorithm (b) the specificity of the UPI investigation increased in comparison to the standard analysis algorithm (a). (Copyright Neurosurgery Department, Inselspital, Bern, Switzerland.

