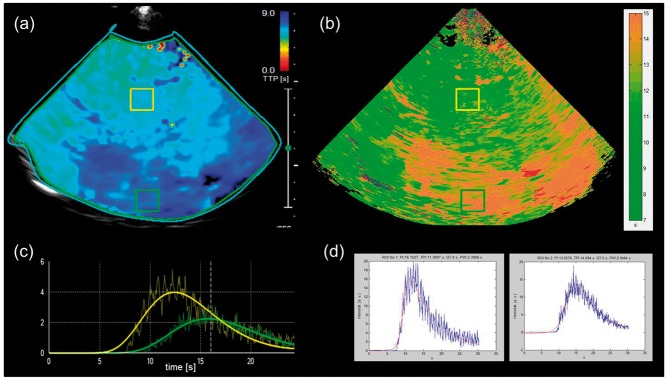
Figure 3.
Comparison of TTP maps and ROI analysis between VueBox and dedicated software. Patient 7 with M1 occlusion of RMCA with imaging performed 278 min after symptom onset. (a) and (b). Screenshots of VueBox derived analysis with color-coded TTP map displaying both hemispheres with a marked area of delayed intensity rise in the RMCA territory (dark blue area a), exemplary time–intensity curves (TIC, c) derived from thalamic area of unaffected hemisphere (yellow box, TTP = 11.41 s), and from hypoperfused cortical area of affected hemisphere (green box, TTP = 14.70 s). (b) and (d). Corresponding color-coded TTP map (b) and example TICs (d) derived from thalamic area (yellow box, TTP = 11.31 s) and cortical area (green box, TTP = 14.69 s) by dedicated software.

