Figure 4.
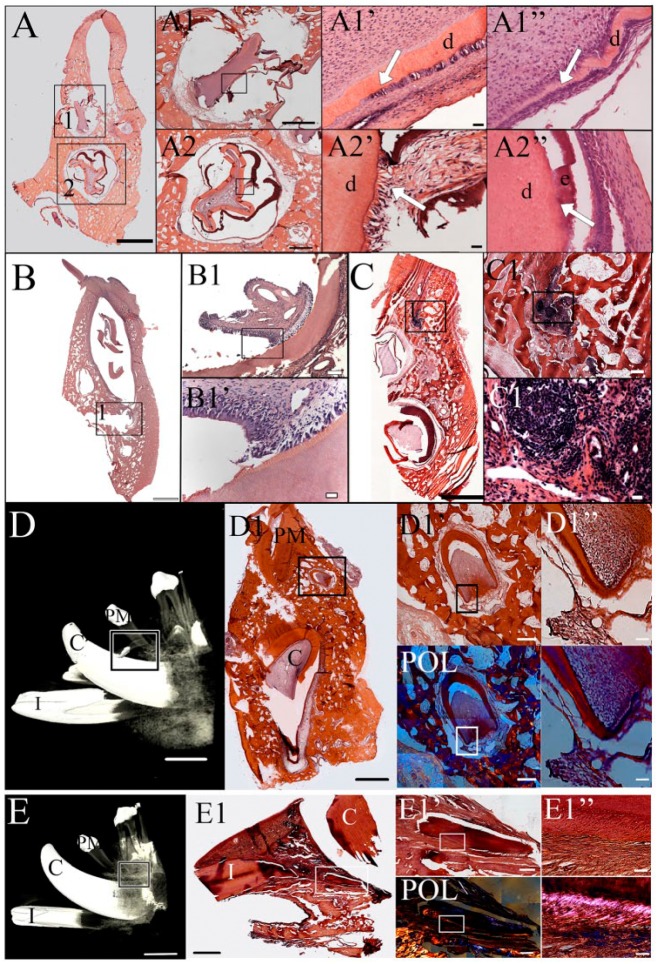
Histological analysis. (A) The recell-dTB tooth exhibited calcified enamel and dentin after 3-mo implantation. (A1, A2) High-magnification images of regenerated crowns shown in boxed areas 1 and 2 of A. (A1’, A2’) High-magnification images of the boxed areas of A1 and A2, respectively. The arrow in A1’ indicates an epithelial root sheath-like structure similar to that of the natural tooth (A1’’). (A2’) Abnormal enamel-dentin junction as compared to natural teeth (A2’’). (B) Dentin-pulp complex in a nTB sample after 3-mo implantation. (B1) Higher-magnification image of the boxed area in B. (B1’) High-magnification image of the boxed area in B1. (C) Necrotic tissue in a dTB sample. (C1) High-magnification image of the boxed area of C. (C1’) High-magnification image of the boxed area of C1. (D) Micro-CT image of well-developed 6-mo implanted nTB (box). (D1) H&E-stained coronal histological section of nTB crown (black box). (D1’) High-magnification image of the boxed area in D1. (D1’’) High-magnification image of the boxed area in D1’. POL indicates polarized light images of D1’ and D1’’. (E) Micro-CT image of a 6-mo recell-dTB implant. Although calcified structures were not detected by micro-CT, a tooth root structure was identified in sagittal histological section (E1, white box). Typical dentin and periodontal ligament-like tissues were identified under bright-field and polarized light (E1’, E1’’). Scale bar = 10 mm in D and E; 2 mm in A–C, D1, and E1; 500 µm in D1’ and E1’; 100 µm in A1–A2, B1, and C1; and 20 µm in A1’–A2’, B1’, C1’, D1’’, and E1’’. C, canal; CT, computed tomography; d, dentin; dTB, decellularized tooth bud; e, enamel; H&E, hematoxylin and eosin; I, incisor; nTB, natural tooth bud; PM, premolar; POL, polarized light.

