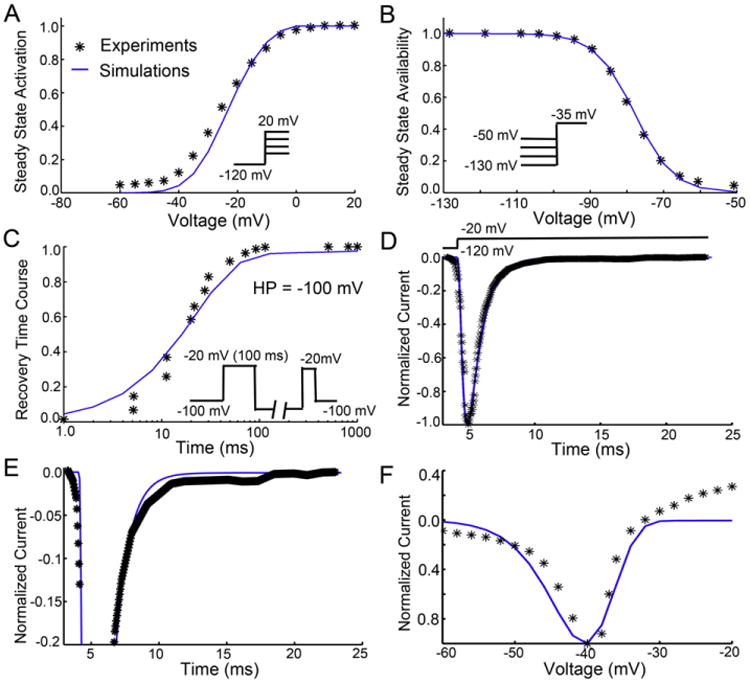
Fig. 2.

Experimental (symbols) and model optimized (lines) drug free Na+ current parameters in a rabbit ventricular myocyte. (A) Na+ current activation curve derived from data generated in response to depolarizing voltage clamp pulses [18]. (B) Steady-state inactivation [18]. (C) Recovery from inactivation at −100 mV [18]. (D) INa waveform in drug free conditions at low gain normalized to peak current [9]. (E) Drug free INa at high gain [9]. (F) Superimposition of model predicted and experimentally recorded drug free or baseline INa in response to a slow depolarizing ramp voltage protocol.
