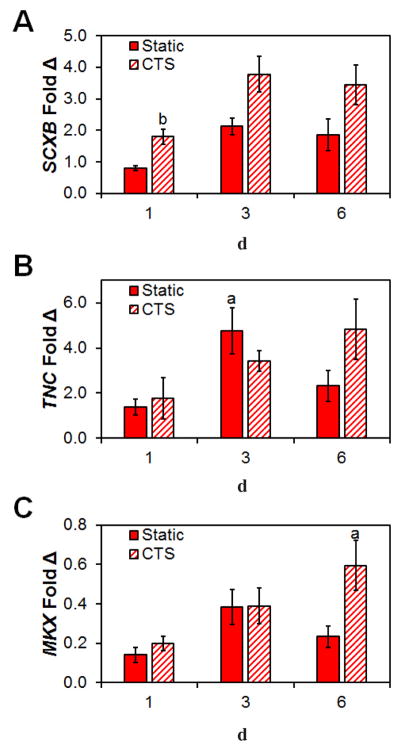
Fig. 4.
Changes on pro-tenogenic gene expression profiles in response to CTS. Expression levels of (A) SCXB, (B) TNC and (C) MKX at day 1, 3 and 6 relative to cells at the time of seeding in both static and CTS groups. Data are shown as mean ± SEM (n = 3). b Significantly higher expression (p < 0.05) than static group at same day. a Significantly higher expression (p < 0.05) than day 1 within the same group.

