
Figure 1.
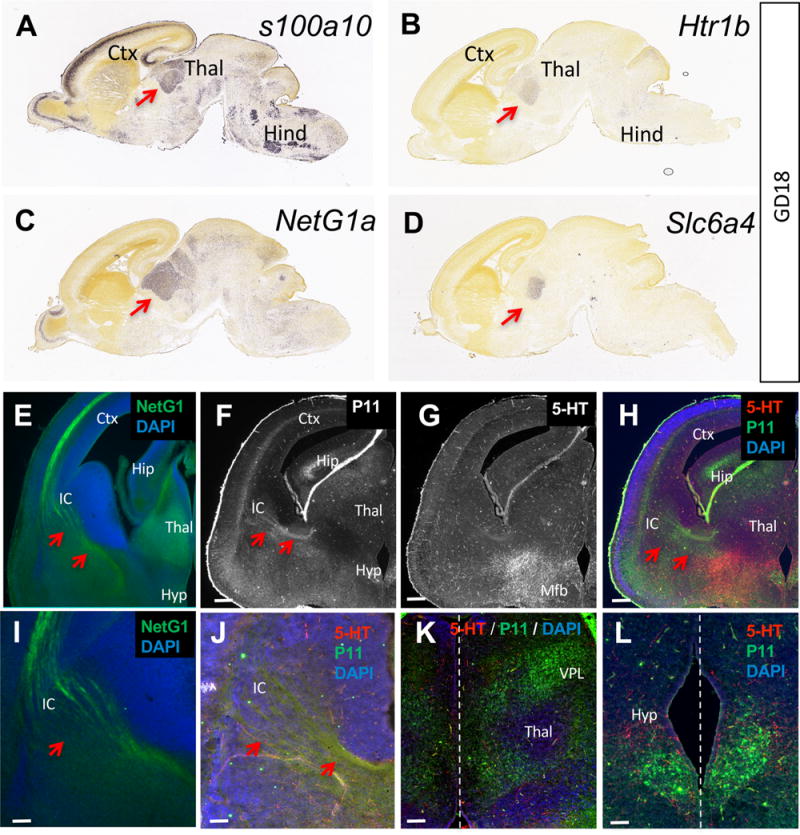
Expression of p11 in the fetal brain. (A) Allen Developing Mouse Brain Atlas in situ hybridization data depicting p11 (s100a10) mRNA expression in the fetal thalamus (Thal; red arrow), cortex (Ctx), and hindbrain (Hind) at GD18. (B, C, D) 5-HT1B (Htr1b) receptor, netrin-G1 (NetG1) and SERT (Slc6a4) mRNA are detected in overlapping patterns with p11 in the thalamus (red arrows). Image credit: Allen Institute. (E–L) Co-labeling with netrin-G1, p11, and 5-HT antibodies on coronal sections show p11+ thalamocortical axons (red arrows), some of which also faintly 5-HT+ (G), growing toward the internal capsule (IC; E, F), dorsal to strongly 5-HT+ axons running through the medial forebrain bundle (Mfb, G). (H) Overlay of p11 and 5-HT immunostainings. Red arrows point to the p11+ thalamic axons. Scale bars represent 200 μm. (I, J) Close-up view of NetG1+, p11+ and 5-HT+ thalamocortical axons (red arrows) coursing through the internal capsule. Scale bar =20 μm. (K, L) p11+ cell bodies are present in ventral posteriolateral nucleus (VPL) of the thalamus (K) and the ventral hypothalamus (Hyp, L). Dotted line represents the midline. Scale bars represent 20 μm. Ctx = cortex, Thal = thalamus, Hip = hippocampus, Mfb = medial forebrain bundle.