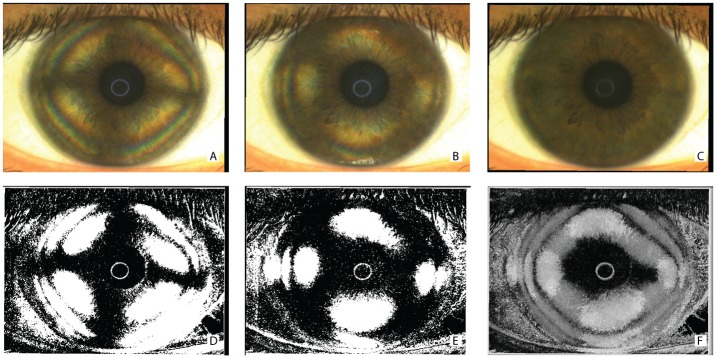
Fig 2. Polarimetric interferometry images of the cornea obtained during acquisition and after software elaboration.
Frames of the acquired raw sequence of a single representative subject (A and B) showing the corneal cross-shaped pattern (A) and the hyperbolic-shaped pattern (B) of the interference figures. The entire sequence of at least 80 images was used to calculate a background illumination image (C). The aforementioned frames were reproduced after subtraction of background luminance and threshold filtering (D, E). A final summary static image (SUM image) was then calculated by further post-processing of the entire sequence and indicates areas where light does not change its polarization during the acquisition (F).

