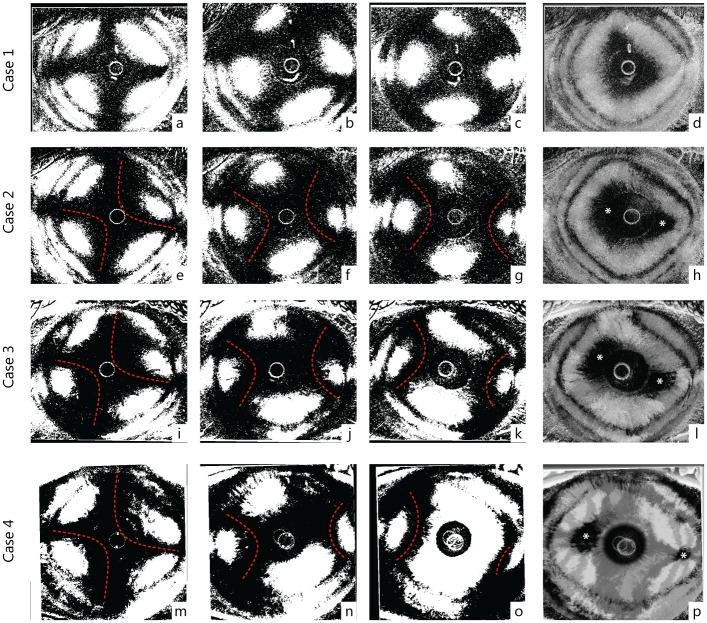
Fig 5. Processed images of four representative cases (right eyes).
The first row (case 1: a-d) shows a type A pattern while the last row represents a typical B pattern (case 4: m-o). Intermediate rows (case 2: e-h, and case 3: e-l) show two patients with intermediate appearance of interference figures, classified as B pattern because of two distinct optic axis (foci) in the SUM image (h, l). Starting from the left, the first column represents the maximum cross-shape pattern appearance (e, i, m), the second an intermediate phase (f, j, m) at 22°30' degree of rotation and the third the maximum hyperbolic arcs separation (g, k, o) at 45°. The last column shows the SUM images (d, h, l, p). Dashed red lines highlight the profiles of the hyperbolic arcs in clearly biaxial cases (Type B pattern) (case 2, 3 and 4). Asterisks mark possible location of the interference figure optic axis (foci).

