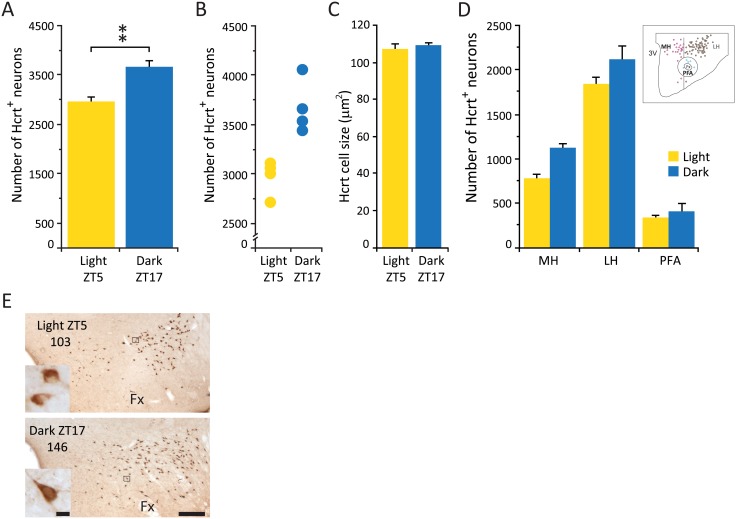
Fig 1. Hcrt neuronal number is increased in dark, but cell size and anatomical distribution are unchanged.
(A) Average number of Hcrt cells in the whole hypothalamus. (B) Total cell counts for each experimental subject. (C) Average size of Hcrt neurons. (D) Distribution of Hcrt neurons in different hypothalamic subdivisions. (D) (insert), Diagram of one hypothalamic section of an experimental animal sacrificed during the light phase indicating the anatomical subdivision used, circles represent Hcrt neurons (purple, medial hypothalamus; brown, lateral hypothalamus; blue, perifornical area). (E) Photomicrographs of the same hypothalamic area of an animal sacrificed in the light phase (ZT5, top) and an animal sacrificed in the dark phase (ZT17, bottom). Numbers indicate cell counts on slide. Inserts are higher (x40) magnification photomicrographs of the selected area (black square) for each experimental condition. Calibration bar 250 μm and 10 μm respectively. Fx, fornix; LH, lateral hypothalamus; MH, medial hypothalamus; PFA, perifornical area; 3V third ventricle. ** p = 0.02, Wilcoxon-Mann-Whitney, n = 4 for each group.

