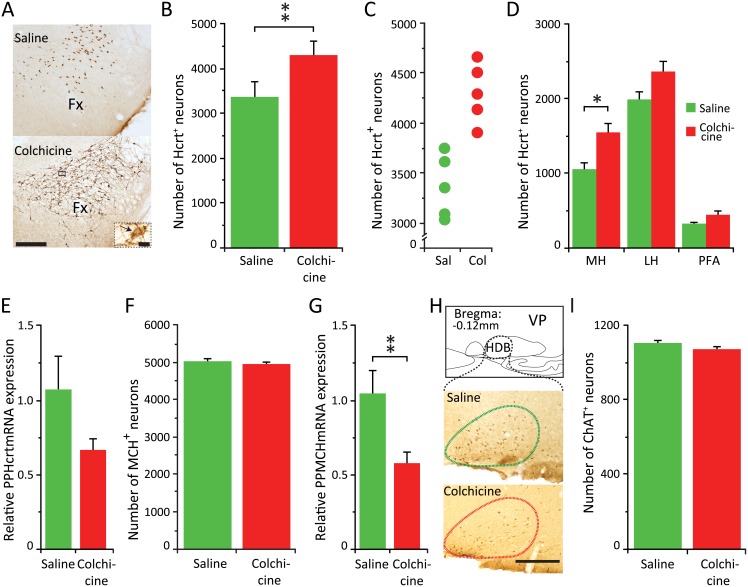
Fig 5. Colchicine further increases the number of Hcrt neurons.
MCH and ChAT neuronal numbers remain unchanged. (A) Photomicrographs of the same hypothalamic area of an animal treated with saline (top) or colchicine (bottom). Calibration bar 250 μm. Insert corresponds to a higher (x60) magnification of the selected area (black square) of the animal that received colchicine. Black arrow indicates an Hcrt neuron. Calibration bar 10 μm. (B) Total cell counts for each experimental subject. (C) Average number of Hcrt neurons in animals with ICV saline vs. ICV colchicine injections (** p = 0.02, Wilcoxon-Mann-Whitney, n = 5 for each group). (D) Distribution of Hcrt neurons in the three different hypothalamic subdivisions regions. Increase is greatest in the medial hypothalamic region (*p<0.05, Wilcoxon-Mann-Whitney with Bonferroni correction). (E) relative PPHcrt mRNA expression in the hypothalamus. The difference is not significant. (F) Average number of MCH neurons in animals with ICV saline vs. ICV colchicine injections. (G) Relative PPMCH mRNA expression in the hypothalamus (** p = 0.02, Wilcoxon-Mann-Whitney, n = 8 for each group). (H) Diagram of the basal forebrain of the mouse depicting the anatomical localization of the cholinergic cell group analyzed. Lower, photomicrographs of the same basal forebrain area of an animal treated with saline (above) or colchicine (below). In contrast to the increase in the staining of the Hcrt and MCH peptide, staining of ChAT is not increased by colchicine treatment. Calibration bar, 250 μm. (I) Average number of ChAT neurons in animals with ICV saline vs. ICV colchicine injections. LH, lateral hypothalamus; MH, medial hypothalamus; PFA, perifornical area; Fx, fornix; HDB, horizontal diagonal band; VP, ventral pallidum.

