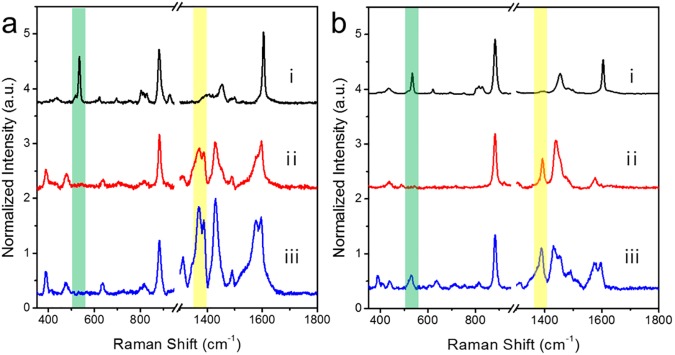
Fig 3. Comparison of surface-enhanced Raman scattering (SERS) spectra of a non-thiol analyte (i; aniline), a thiol analyte (ii; 4-ATP) and their mixture (iii; same quantities of aniline and 4-ATP).
(a) Raman spectra of SiO2@Ag NPs and (b) SiO2@Ag@SiO2 NPs. Raman spectra were obtained by 532 nm photoexcitation and 10s acquisition. Intensities were normalized to Raman intensity of the ethanol peak at 882 cm−1. The characteristic aniline peaks were not detected in the spectrum of the mixture when the SiO2@Ag NP SERS substrate was used. However, both peaks of aniline and 4-ATP were detected at similar intensities when the SiO2@Ag@SiO2 NPs was used as SERS substrate. Baselines were adjusted for the clarity of comparison.

