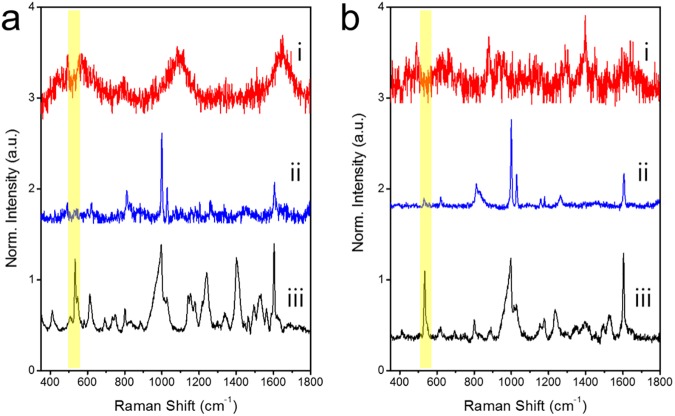
Fig 6. Comparison of surface-enhanced Raman scattering (SERS) spectra.
(a) Raman spectra of river water. (i) River water only, (ii) aniline in river water with SiO2@Ag NPs, and (iii) aniline in river water with SiO2@Ag@SiO2 NPs. (b) Raman spectra of tap water. (i) Tap water only, (ii) aniline in tap water with SiO2@Ag NPs, (iii) aniline in tap water with SiO2@Ag@SiO2 NPs. All Raman spectra were measured at laser power of 10 mW with acquisition time of 10 s. Intensities were normalized to Raman intensity of ethanol peak at 882 cm−1.

