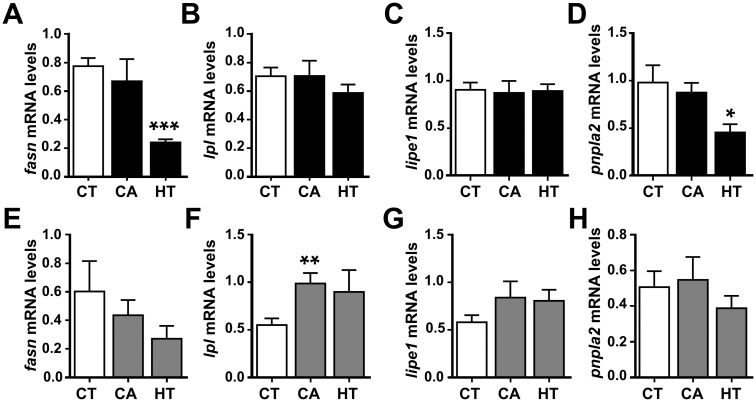
Fig 5. qRT-PCR analysis of selected lipid-metabolism-related gene transcript levels in the dissected perivisceral WAT (A-D) and liver (E-H) of rainbow trout treated with CA and HT or untreated.
After one-day fasting, juvenile rainbow trout received intraperitoneal injections of vehicle CT (DMSO in sesame oil 1:3, v/v), vehicle plus CA (10 μg/g body weight), or vehicle plus HT (20 μg/g body weight), and samples were taken after a 24 h exposure period in a fasting state. mRNA levels of fasn (A, E), lpl (B, F), lipe1 (C, G) and pnpla2 (D, H). All mRNA levels were normalized to the geometric mean of the two reference genes, ef1a and actb. Data are shown as mean ± SEM (n = 7–8 fish per condition). *p ≤ 0.05, **p ≤ 0.01, ***p ≤ 0.0001, compared to CT, using Student's t-test.

