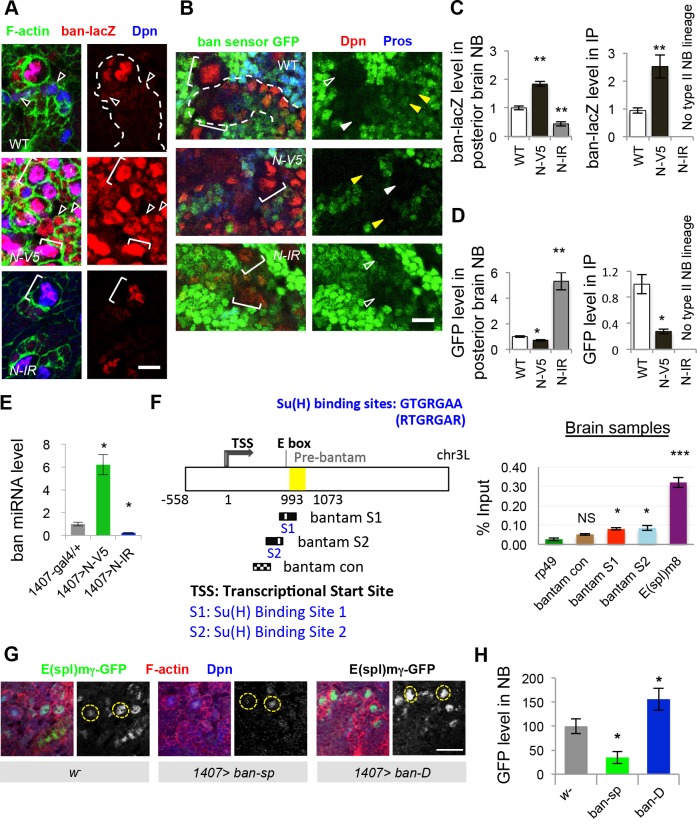
Fig 3. Regulation of ban expression and activity by N signaling and feedback regulation of N activity by ban.
(A) Effects of N OE and N RNAi (N-IR) on ban expression as monitored with the ban-lacZ transcriptional reporter in type II NB lineages. N-V5 or N-IR transgene induction was carried out using a 1407ts system (1407-GAL4: tub-GAL80ts). Larva were shifted to 29°C at 24 hr ALH, and analyzed at late third instars. Green, F-actin; Red, LacZ; Blue, Dpn; Bracket, NB; Arrowheads, mature IPs. Note that N-IR brain has no type II NB lineages. (B) Effects of N OE and N-IR on ban activity as measured with ban GFP sensor expression. Green, GFP; Red, Dpn; Blue, Pros; Bracket, NBs; Open arrowhead, type I NB; Closed arrowhead and dotted outline, type II NB and its lineage; Yellow arrowhead, mature IP. (C) Quantification of ban-LacZ expression shown in A. n = 10–15 type I or II NBs from posterior brain /genotype (left), and n = 16–22 mature IPs/genotype (right). **, p<0.0005. (D) Quantification of ban GFP sensor expression. n = 5 type I or II NBs from posterior brain/genotype (left), and n = 5 mature IPs /genotype (right). *, p<0.005; **, p<0.0005. (E) Quantitative RT-PCR analysis of ban levels in third instar larval brains. ban levels were normalized to 2S rRNA. *, p<0.005; mean ± SEM, n = 3 repeats. (F) ChIP analysis of Su(H) binding to genomic DNA in ban locus. (Left) Schematic drawing of the ban locus. The position of pre-miRNA sequence in yellow box is between 993–1073 nucleotides (counting from transcription start site at position 1). Sequences containing two putative Su(H)-binding sites (S1 and S2) that matched the consensus sequence RTGRGAA, and a control sequence that does not contain Su(H)-binding site (ban con) in the upstream regulatory region of pre-bantam are indicated. (Right) Histogram showing enrichment of ban genomic sequence surrounding S1, S2, but not the ban con region, in the Su(H) ChIP. E(spl)m8 and rp49 are positive and negative controls, respectively. ***, p<0.0001; *, p<0.005, n = 3 repeats. (G, H) Effects of ban LOF and GOF on E(spl)mγ-GFP reporter expression in type I NBs located in posterior brain region. H, quantification of GFP fluorescence intensity from G. *, p<0.005; Scale bars: A, B, 10 μm; G, 20 μm.

