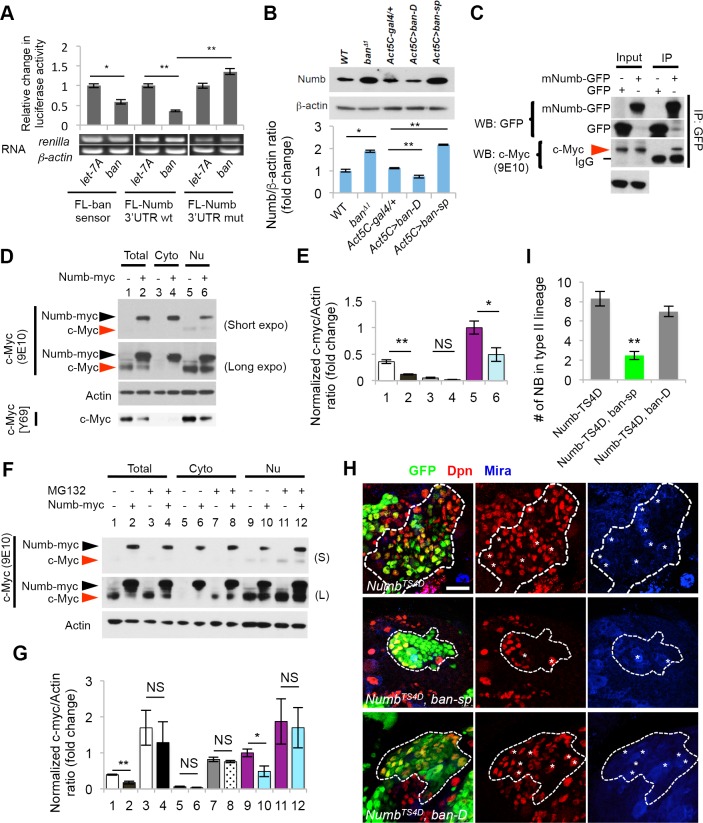
Fig 4. Numb is a target of ban and it negatively regulates Myc.
(A) Translational reporter assay showing targeting of numb 3´UTR by ban miRNA. Luciferase activity derived from firefly luciferase (FL)-ban sensor, renila luciferase (RL)-numb 3´UTR, or RL-numb 3´UTRmut reporters in response to ban-5P miRNA co-expression was normalized with values from let-7A control miRNA co-expression. *, p<0.05; **, p<0.001. n = 3 repeats. The gel images under the bar graph represent measurements of luciferase mRNA expression by RT-PCR, with actin serving as a control. (B) Western blot analysis of larval brain extracts showing effects of ban LOF or GOF on Numb protein levels. Actin serves as loading control. Bar graph shows quantification of normalized Numb signals from three independent blots. *, p<0.001. n = 3 repeats. (C) Co-IP between Numb and c-Myc in HEK293T cells. GFP-mNumb or GFP vector was transfected into HEK293T cells. Anti-GFP immunoprecipitates were probed for GFP and c-Myc by western blot. (D) Western blot analysis of c-Myc levels in various cellular fractions from HEK293T cells in response to Numb-myc (myc epitope tagged Numb) expression. The anti-c-Myc (9E10) was used to detect both c-Myc and Numb-myc. c-Myc levels were quantified after normalization to Actin. Total: total lysates (#1, #2); Cyto: cytosol fractions (#3, #4); Nu: nuclear fractions (#5, #6). Effect of Numb on endogenous cMyc level was verified with another anti-c-Myc Ab (Y69). (E) Quantification of c-Myc levels from (D) after normalization to Actin. c-Myc levels detected by c-Myc (9E10) were quantified in comparison to nuclear lysates in #5. *, p<0.05, **, p<0.005; n = 3 independent experiments. (F) Effect of the proteasome inhibitor MG132 on endogenous c-Myc level in Numb transfected HEK293 cells. HEK293T cells with or without Numb-myc transfection were incubated in the presence or absence of 10 μM MG132 for 2 hrs. Cell lysates (#1-#12) were analyzed by western blot as indicated. (S): Short exposure; (L): Long exposure. (G) Quantification of c-Myc levels upon MG132 treatment shown in F. *, p<0.05; **, p<0.001; ***, p<0.0001 vs. without MG132 treatment. n = 3 independent experiments. (H, I) Genetic interaction between Numb-TS4D and ban in regulating NB homeostasis. Type II NB lineages co-expressing Numb-TS4D and ban-sp or Numb-TS4D and ban-D are marked with white dashed lines. Asterisks indicate ectopic NBs in the clones. J, quantification of NB number in type II NB clones from I. **, p<0.00001; n = 8–10 NB clones. Scale bars: H, 20 μm.

