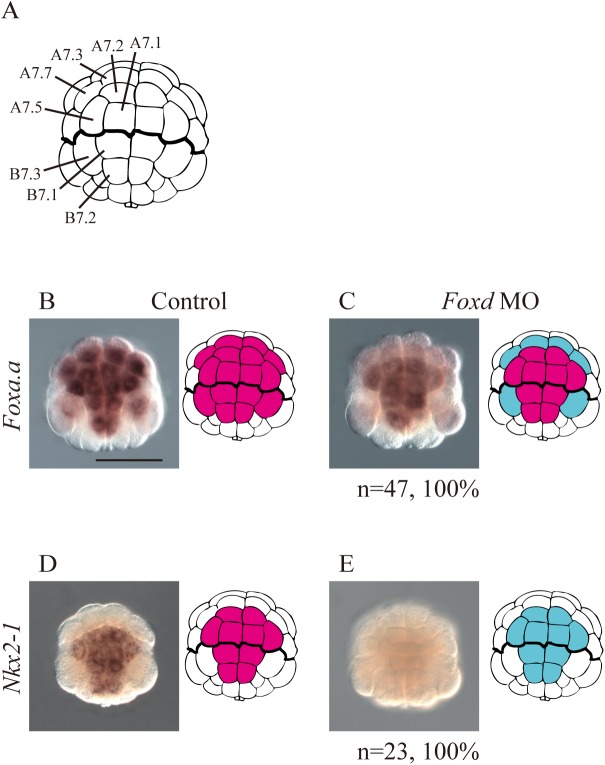
Fig 3. In situ hybridization analysis to determine if Foxa.a and Nkx2-1 are controlled by Foxd at the 64-cell stage.
(A) Illustrations of the vegetal hemisphere of the 64-cell embryo. Blastomere names are indicated in the left half of the bilaterally symmetrical embryo. (B–E) The expression of (B, C) Foxa.a, and (D, E) Nkx2-1 in (B, D) control unperturbed embryos and (C, E) Foxd morphant embryos. Illustrations on the right indicate the expression patterns. Blastomeres with expression are filled in magenta. Blastomeres that lost expression in Foxd morphants are shown in cyan. The number of morphant embryos examined and the proportion of embryos that each panel represents are shown below the panels. Scale bar, 100 μm.

